

This is the first of a two-part series about mesothelioma forecasting. In this post we will comment on the incidence of mesothelioma in the general population, which is holding steady and exceeding the predictions of the standard epidemiological and demographic models. In a follow-up post, will dive into the importance of combining industry and company specific experience at the local level, in combination with actuarial forecasting techniques, to usefully forecast asbestos liabilities.
One of the most widely used and respected studies of occupational exposure to asbestos is “Occupational Exposure to Asbestos: Population at Risk and Projected Mortality 1980-2030” by Messrs. Nicholson, Perkel and Selikoff, published in the American Journal of Industrial Medicine in 1982. It includes what is commonly referred to as the “Nicholson curve”. This prediction of the incidence of mesothelioma in the general population has been one of the most widely used tools in forecasting asbestos liabilities for individual corporations.
At the beginning of 1973, the National Cancer Institute began collecting cancer data from nine regions across the United States as part of the Surveillance, Epidemiology, and End Results (SEER) Program. Those nine regions, or “SEER 9 registries”, cover 28 percent of the entire U.S. population. The program uses cancer diagnoses from these registries to calculate an incidence rate per 100,000 people that can be extrapolated across the entire country. This post uses the SEER 9 registry data (November 2016 submission) as a basis for analysis.
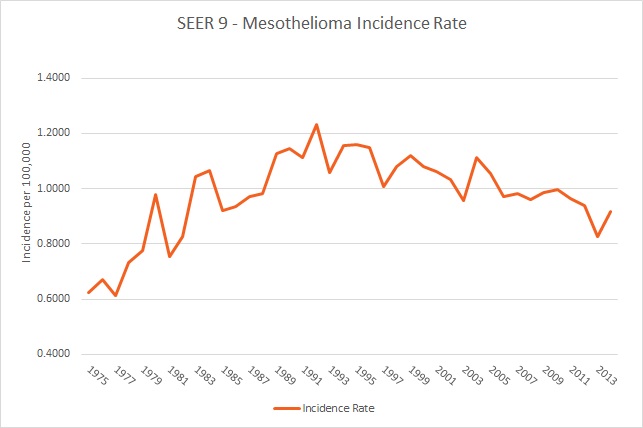
The mesothelioma incidence rate per 100,000 people gathered from the SEER 9 registries is shown below. The rate peaked in 1992 and has been trending downward since.
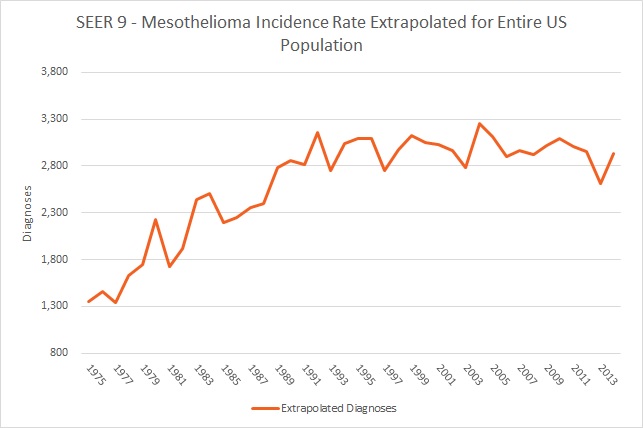
The SEER program uses population data to extrapolate the incidence rate to the other 72 percent of the country. According to that population data, which originates from the U.S. Census Bureau, the nation’s population experienced a steady, linear increase from just over 215 million people in 1975 to nearly 319 million in 2014. The graph below represents the incidence rate from the SEER 9 registries applied to the entire population. Because of the increasing population, the decreasing incidence rate does not correspond to any significant decrease in total diagnoses, which have been relatively steady since the late 1980s.
The calculation of the Nicholson curve started by estimating the total population of workers in the 13 industries considered at-risk for asbestos exposure. Using data from the Bureau of Labor Statistics, the study estimated that 27.5 million workers were exposed between 1940 and 1979. The resulting mesothelioma incidence among that population was then calculated by incorporating the probability of contracting mesothelioma by industry. That probability, or “relative risk”, was based on each industry’s average duration of employment, magnitude of exposure, and the age distribution of newly hired employees. Individual forecasters often choose to adjust the Nicholson curve to reflect the observed diagnosis data released by the SEER program and other factors.
As can be seen in the graph below, the prediction of mesothelioma incidence from the Nicholson study and the observed incidence from the SEER data have historically tracked quite closely. However, we are starting to see some significant divergence, with mesothelioma incidence remaining steady and not dropping off as predicted.
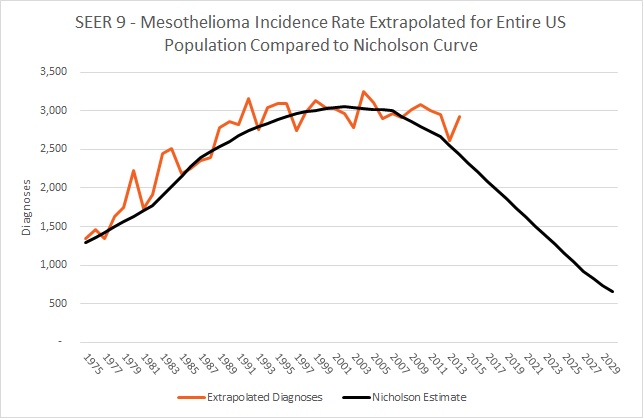
The Nicholson curve has a traditional bell-curve shape that predicts mesothelioma incidence dropping off after peaking in 2002. However, the SEER diagnosis data has not shown a significant increase or decrease at the 95 percent confidence level since the 1980s. A number of explanations have been proposed, including increased life expectancy, which results in more time for any exposed person to develop mesothelioma; diagnoses resulting from secondary exposure or industries not included in Nicholson’s analysis; or any other variable unaccounted for in the original Nicholson projection.
Yet to be seen is whether the actual observed mesothelioma diagnoses will continue to follow the path predicted by Nicholson. If the observed diagnoses continue to hold steady, then the Nicholson curve, which is widely used across the industry for predicting mesothelioma deaths, will underestimate the true number of diagnoses and subsequent claim filings. That is why it is critical for forecasters to account for the impact of client-specific factors to adjust their models. At KCIC, we have the advantage not only of substantial industry experience, but also real-time data resources to validate changes in the mesothelioma claims landscape.
Stay tuned for Part Two where we discuss just that!